Solana Price Tumbles to $200 Support as RSI Signals Oversold Conditions
Solana’s price has notably retraced from the $260 resistance level, now settling in the $200 support zone. With the RSI currently showing oversold conditions, traders are eager for a potential bounce.
Overview
- Solana’s price has dropped from the $260 resistance to the $200 support region.
- The 0.618 Fibonacci retracement coincides with the oversold RSI, forming a strong technical confluence.
- If the $200 support level holds, Solana may rally towards the $230–$260 range.
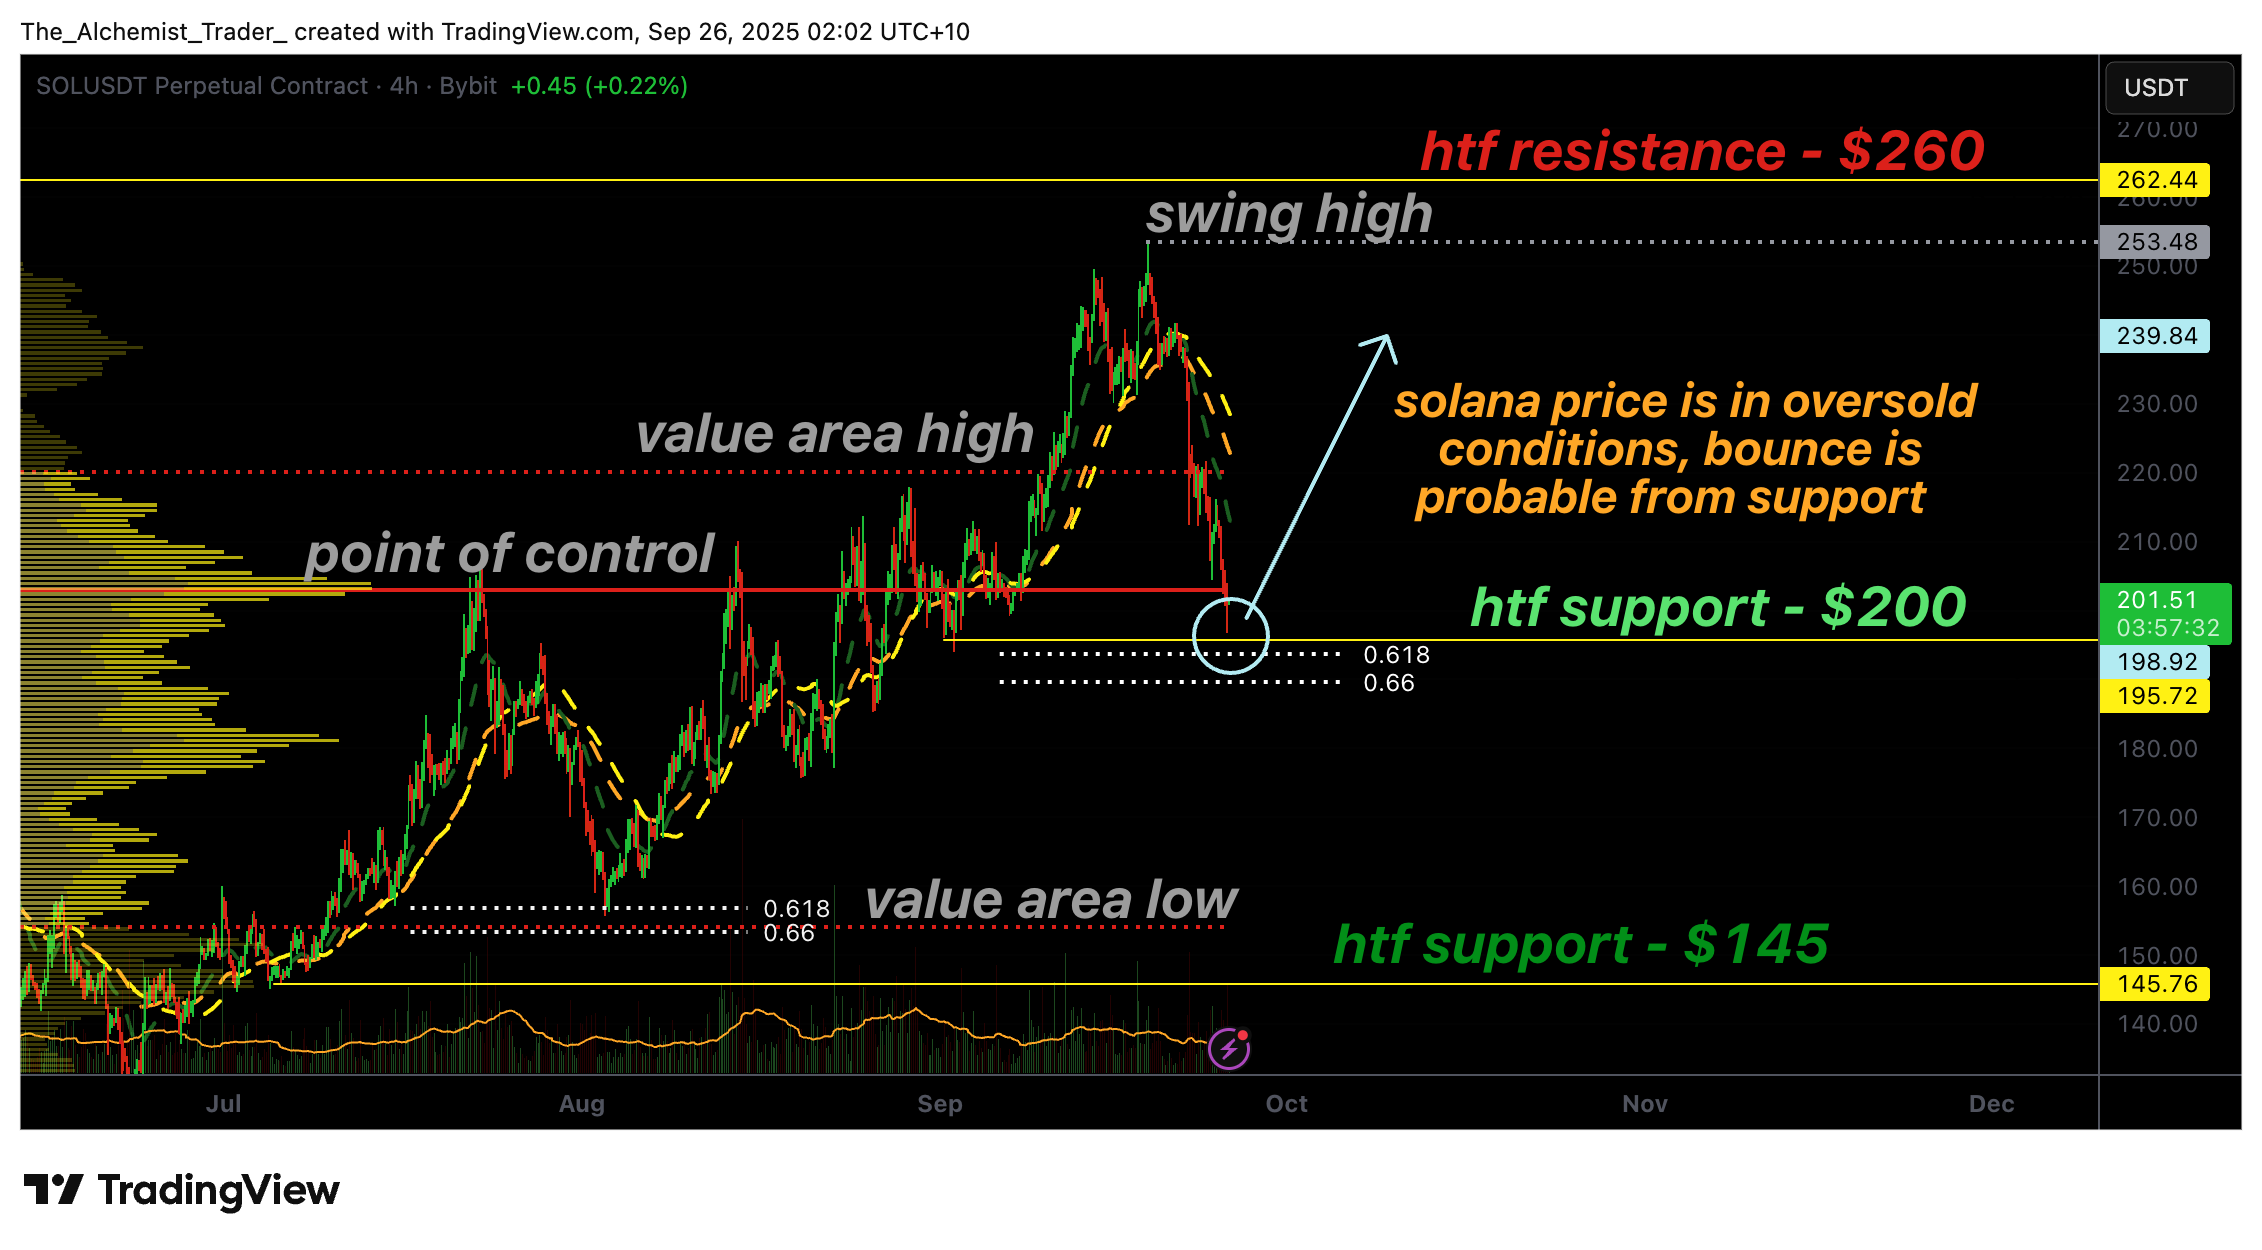
Solana’s price action shifted dramatically after reaching just below $260. A series of higher highs and higher lows created a bullish trend until resistance halted the advance. This led to a significant sell-off, breaking through the point of control (POC) and the value area high (VAH) before stabilizing around the $200 mark.
This area aligns with the high-time-frame 0.618 Fibonacci retracement, a level where Solana has historically exhibited strong reactionary movements. Adding to this context, Kazakhstan is set to launch a stablecoin backed by Solana, Mastercard, and a prominent local bank, which could bolster Solana’s long-term prospects.
Key Technical Points for Solana’s Price
- Support Examination: The price has dropped to the $200 level, aligning with the 0.618 Fibonacci confluence.
- Oversold RSI: The indicator is currently below 30, suggesting a potential end to selling pressure.
- Possible Rebound: Historical trends show that Solana frequently rebounds from 0.618 levels toward previous highs.
The recent bearish trend was swift and intense, resembling prior instances where Solana responded to the 0.618 Fibonacci retracement as a crucial level. This prominent high-time-frame support might attract buyers seeking value post-decline.
From a structural perspective, the $200 support level is not only a Fibonacci alignment but also serves as a critical psychological round-number milestone where liquidity pools are likely to form. A recovery from this position could restore Solana’s bullish trajectory, directing price action back toward neutral volume levels like the VAH and ultimately retesting the $260 resistance.
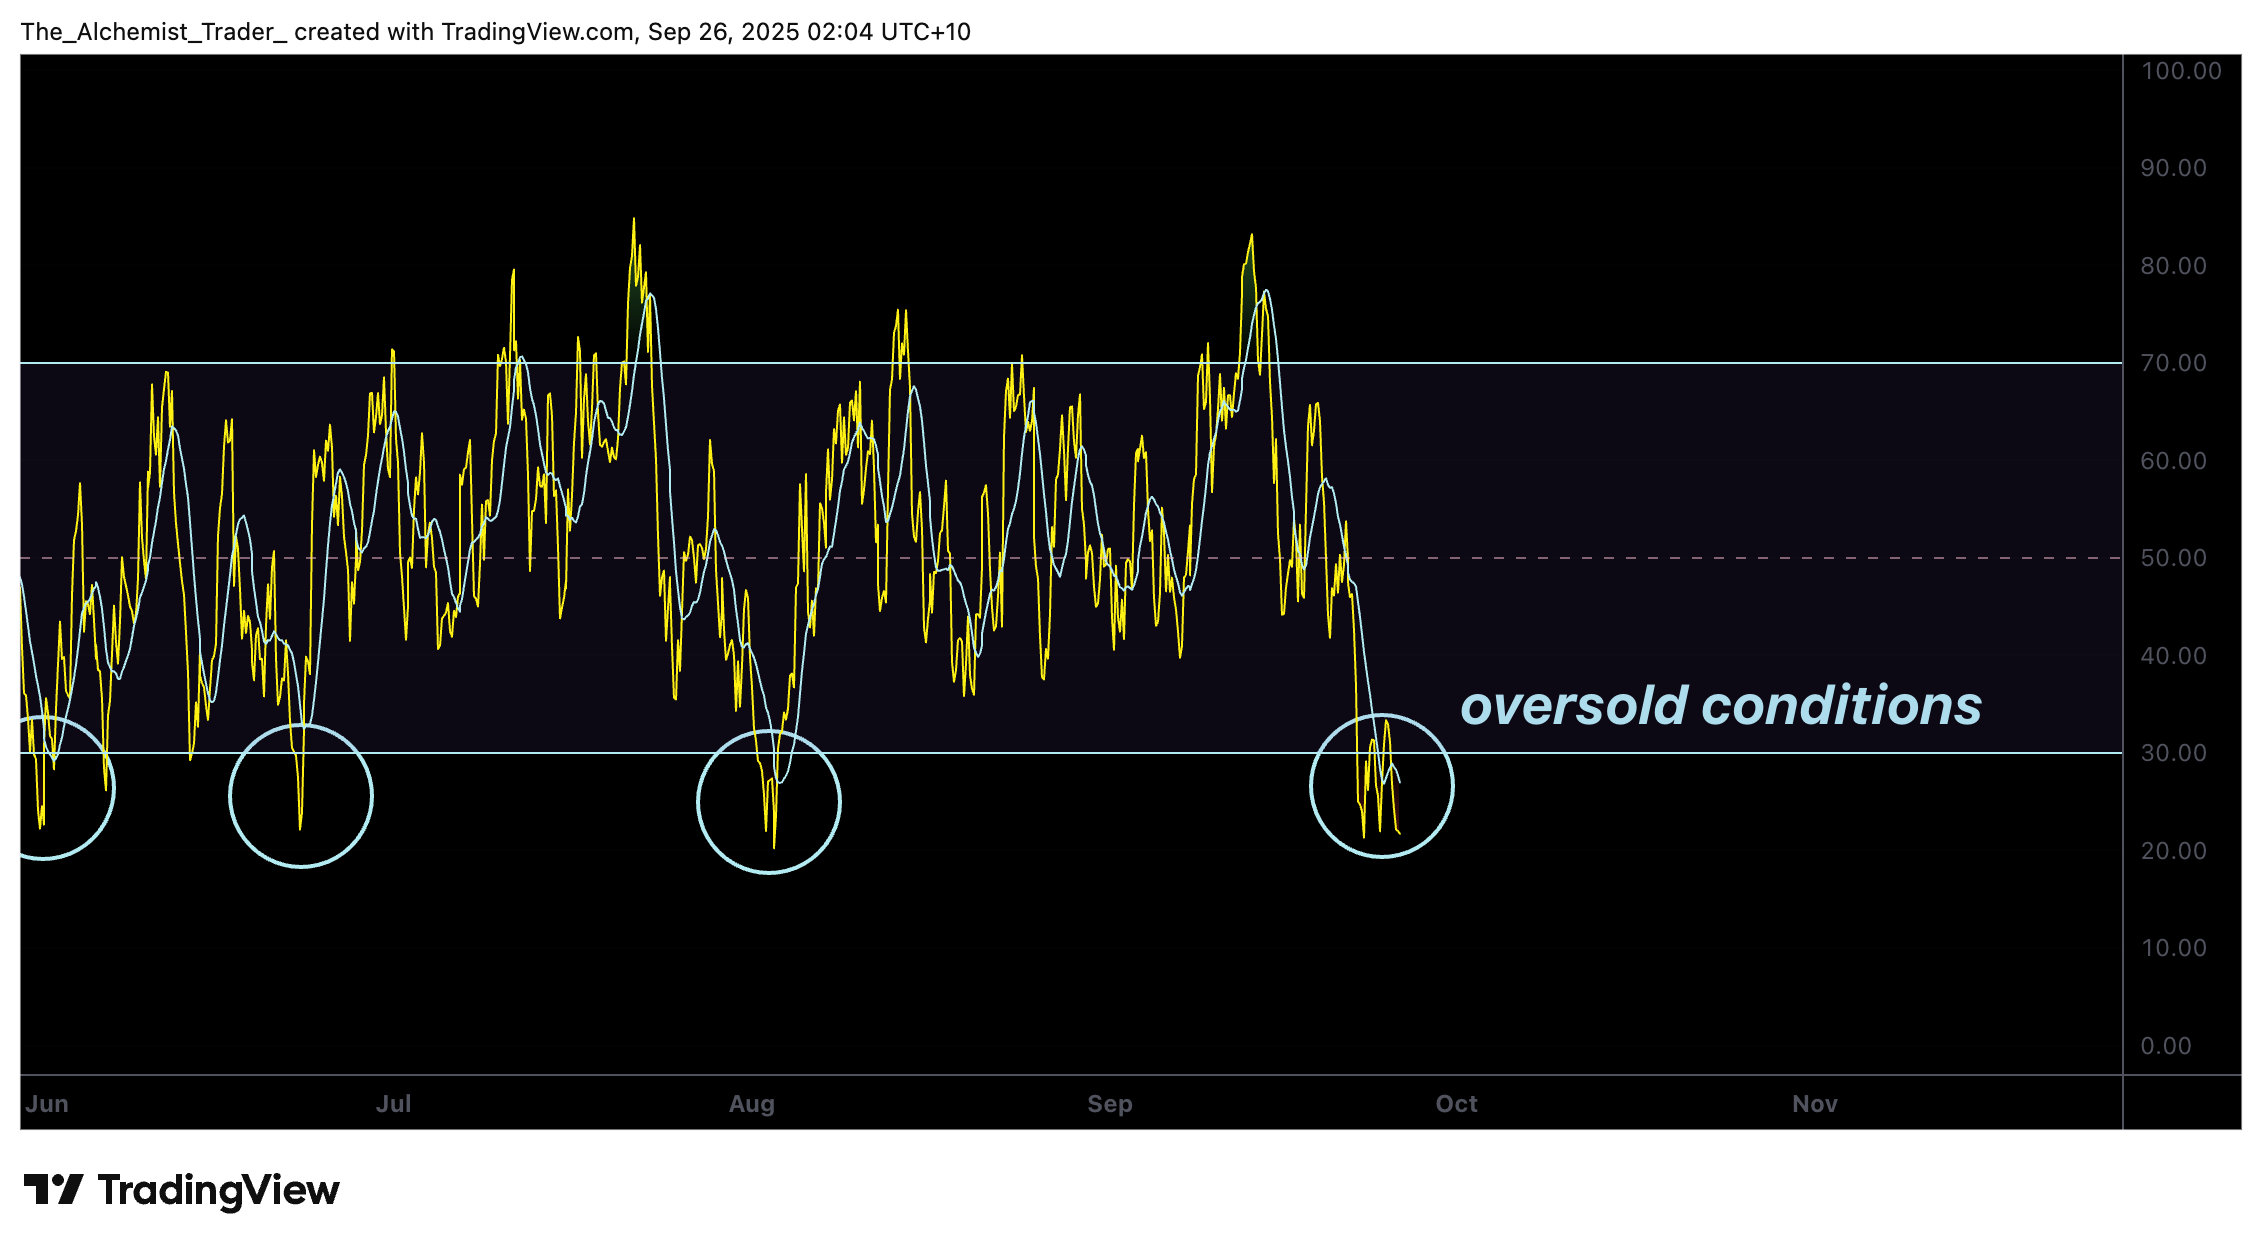
Momentum indicators further support this narrative. The RSI, presently below the 30 mark, indicates oversold conditions that are typically not sustained for long. Historically, falling below this level precedes relief rallies, driven by short covering and opportunistic buying from bulls.
Analyzing volume will be vital in confirming this outlook. If demand rises at these lows, it could signal the end of the current bearish phase and pave the way for another bullish trend. Conversely, failing to hold the $200 support could unveil deeper liquidity levels, with additional supports located below.
Enhancing the broader ecosystem, PancakeSwap has begun facilitating Solana in cross-chain swaps, allowing users to trade tokens across various blockchains effortlessly.
Anticipations for Upcoming Price Action
In the short term, Solana’s oversold RSI and solid support at $200 suggest the potential for a rebound. Successfully maintaining this area could spark a movement toward the $230–$260 range.